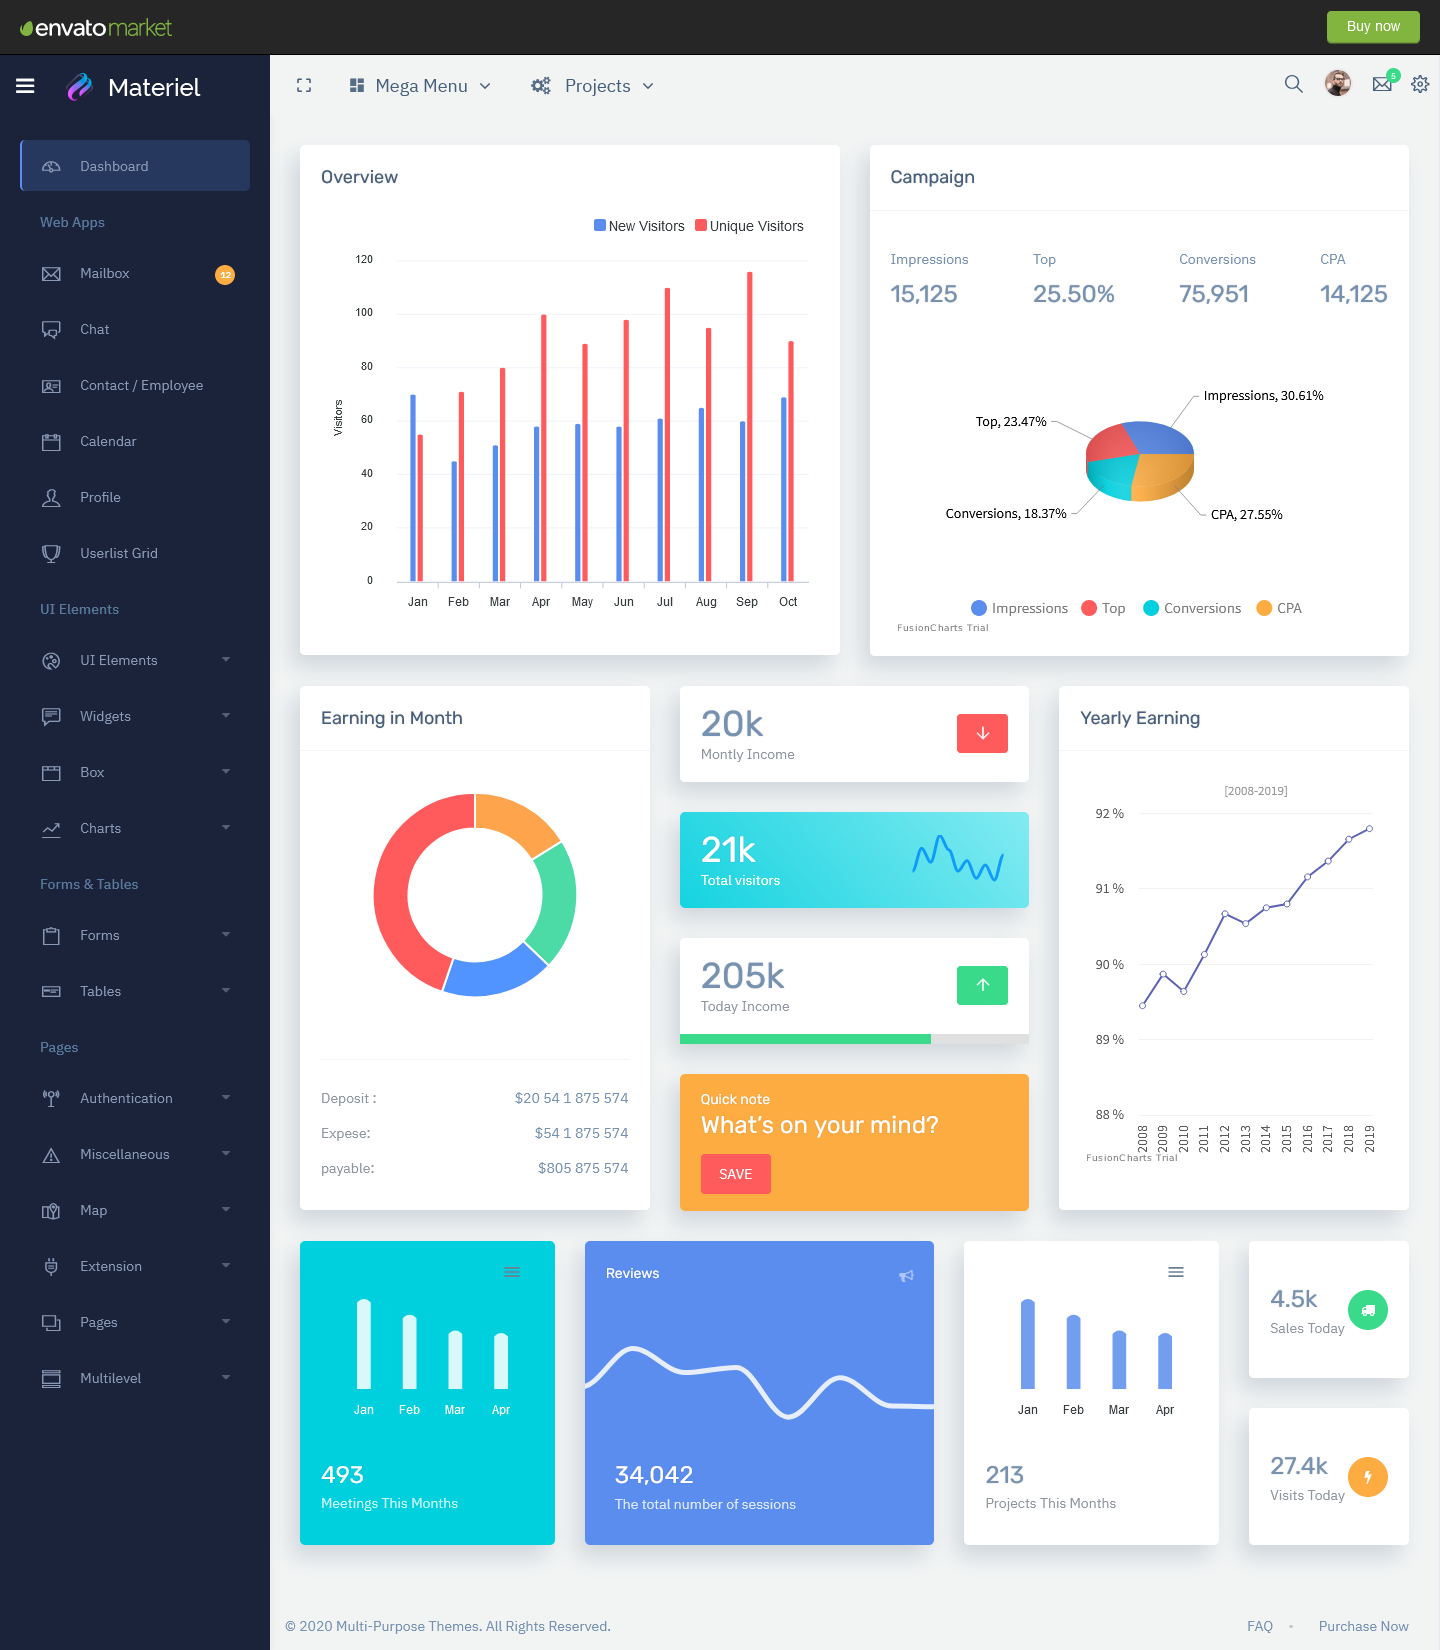
Analytical Dashboard Metrics and Visualizations in Materiel Admin
In Materiel admin, An Analytical Dashboard provides a comprehensive overview of various metrics that are important to understanding business performance. It typically includes data such as new and unique visitors, campaign performance (impressions, conversions, CPA), top earners for the month, monthly income, total visitors, today’s income, quick notes, yearly earnings, meetings scheduled for the month, total number of sessions, projects initiated in the current month, sales figures for the day, and visits recorded on the current day. This consolidated view allows stakeholders at all levels of the organization to quickly grasp the current state of affairs and identify areas that require attention.
Features of Bootstrap Admin HTML is its ability to visualize complex data sets into easily understandable charts, graphs, and tables. For example, the overview of new and unique visitors can be presented through line graphs showing trends over time, while campaign performance metrics displayed using pie charts to compare different campaigns. These visual representations not only simplify data interpretation but also facilitate quick decision-making.
BUY NOW
Dashboard of Materiel Admin
Main Dashboard
MORE INFO / BUY NOW DEMO
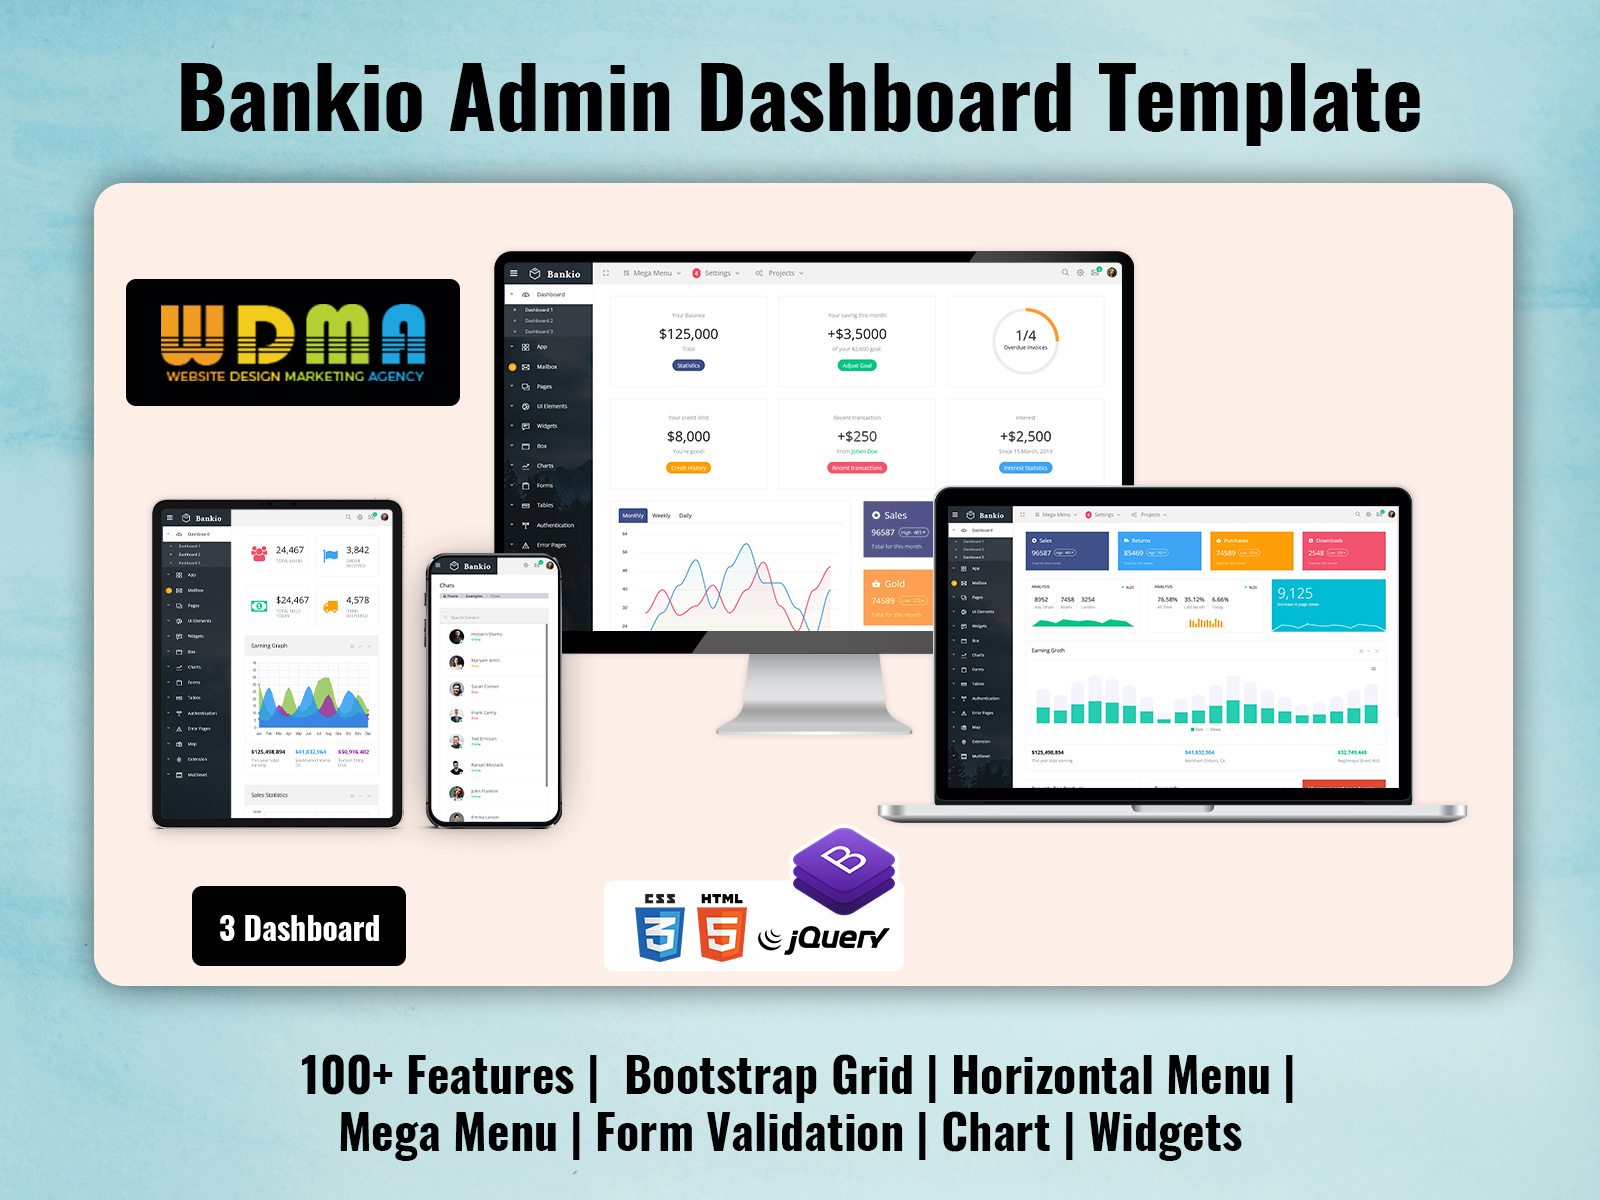
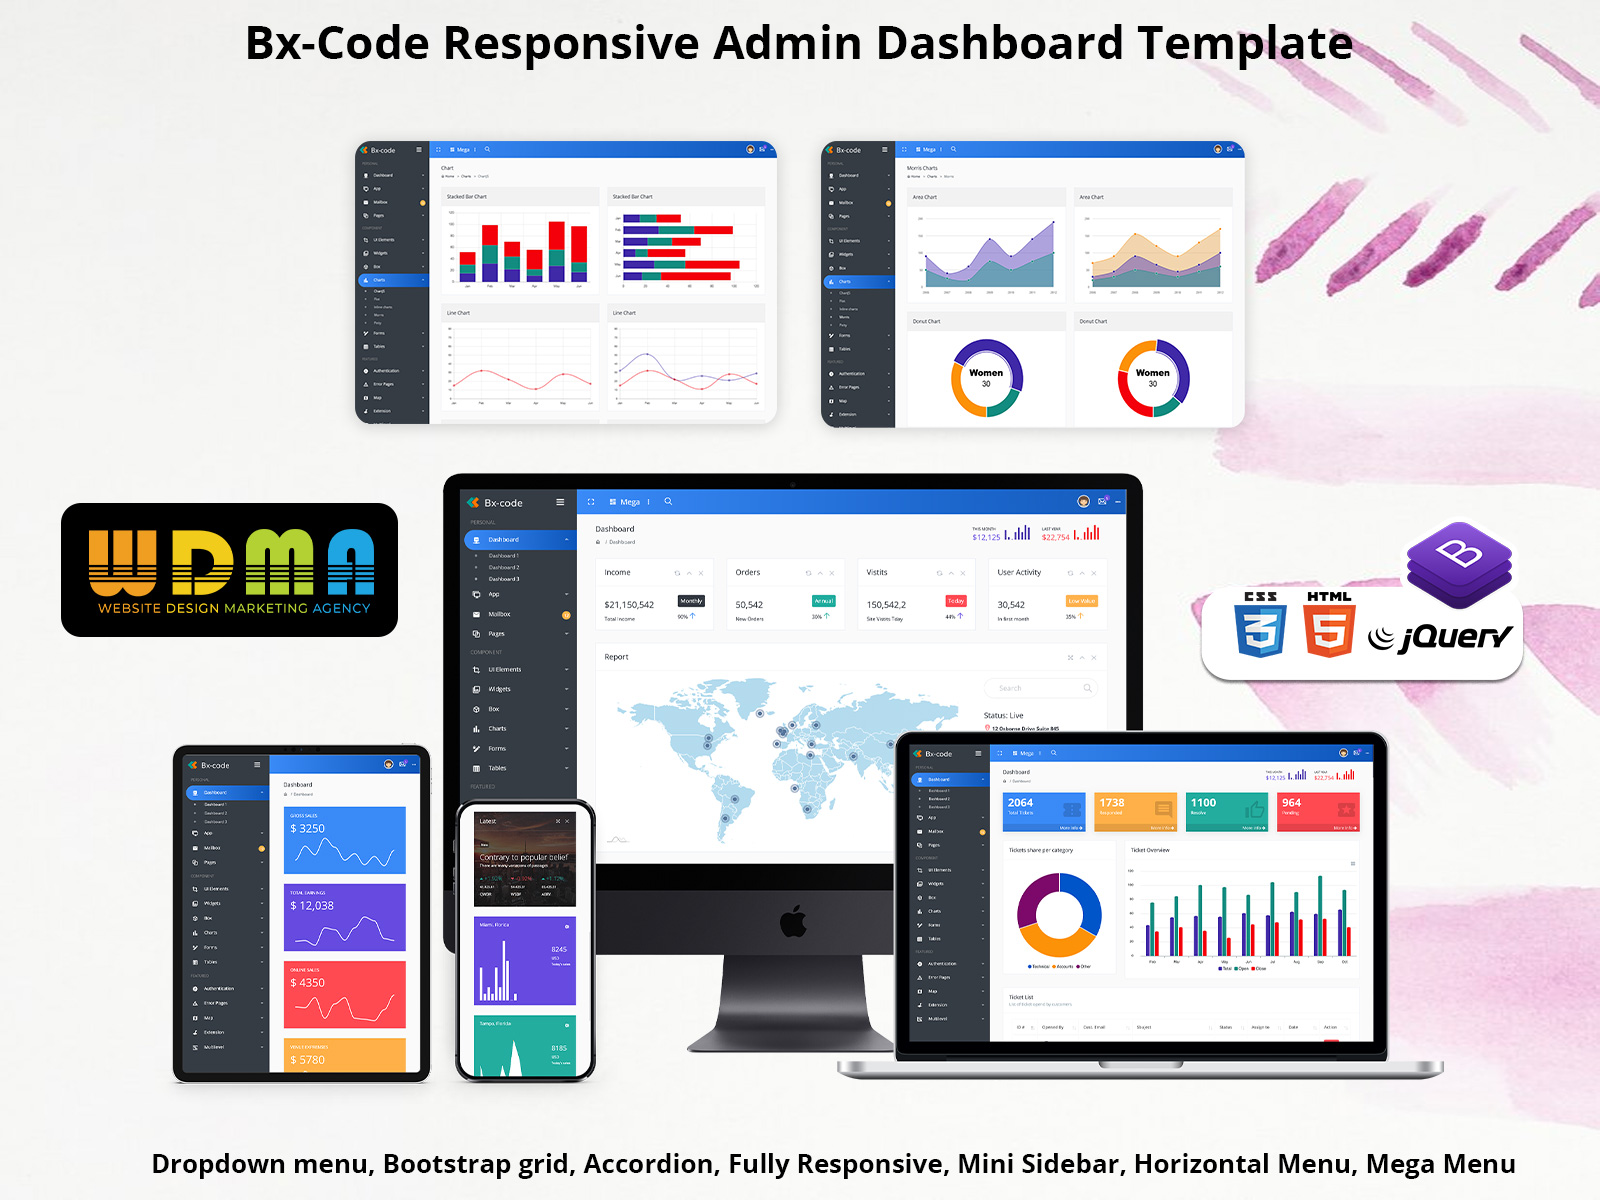
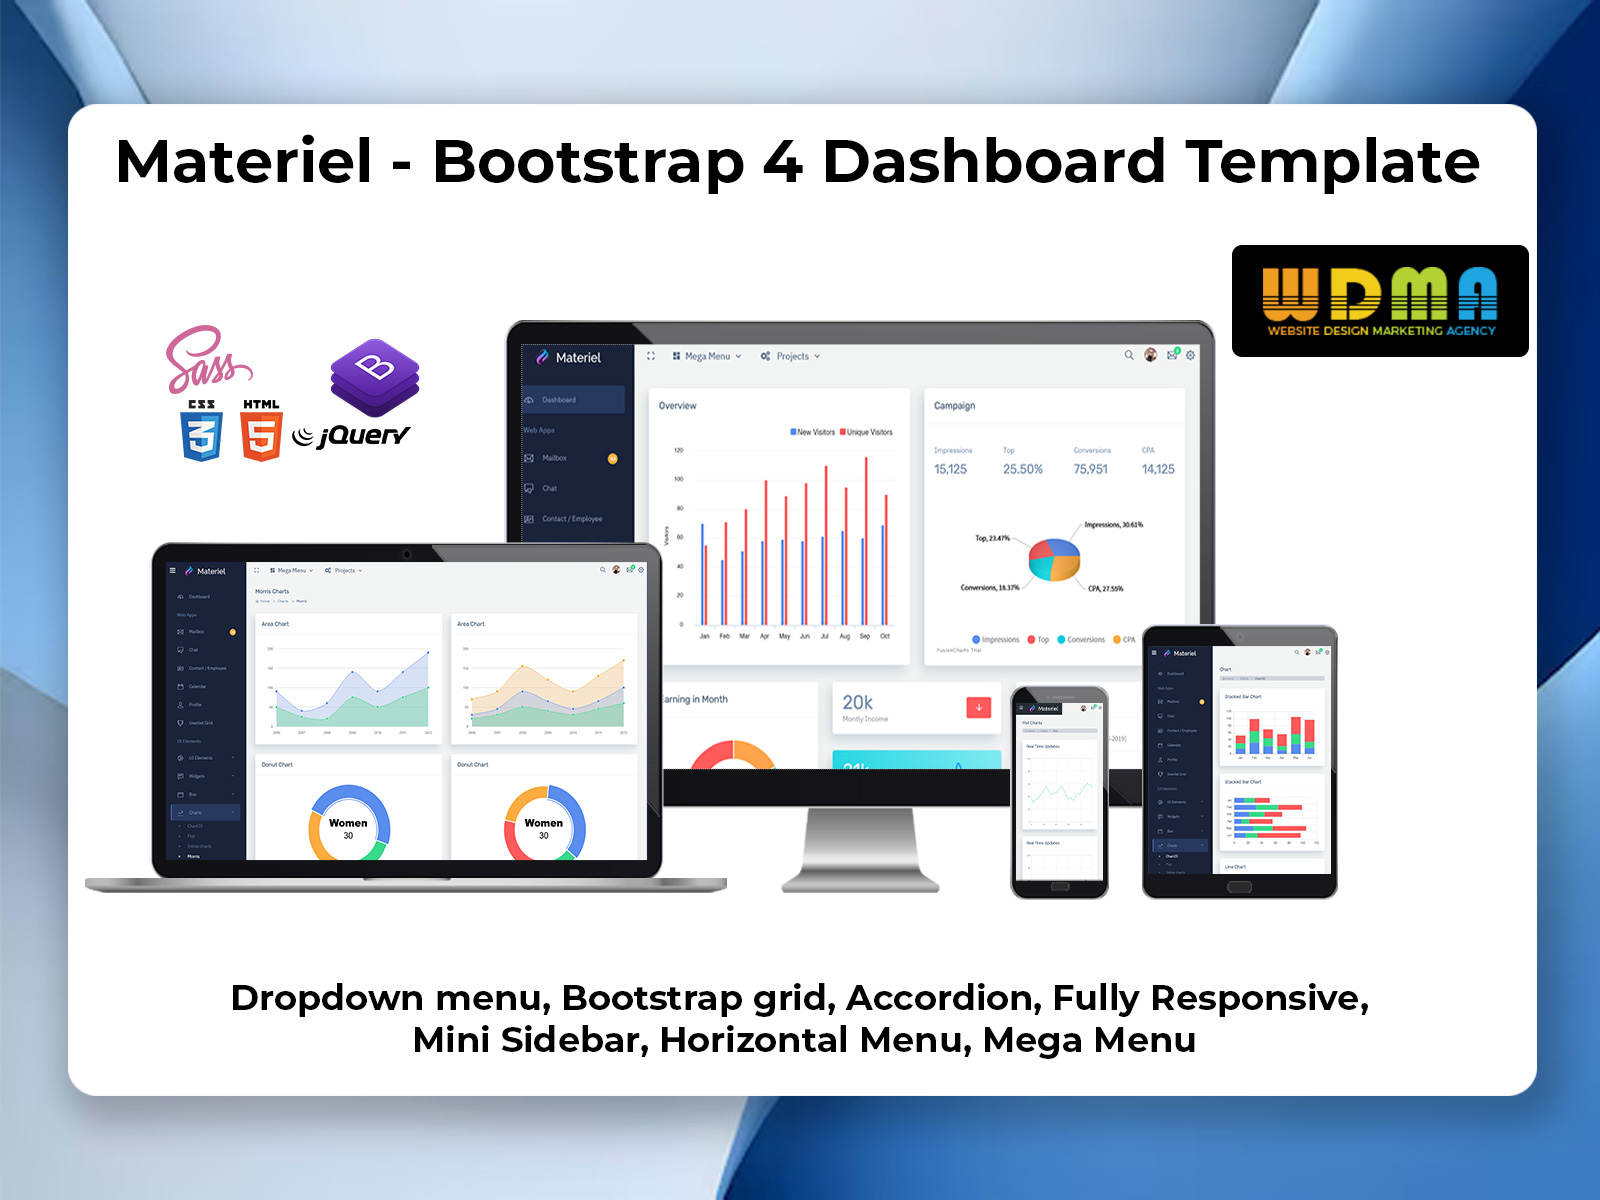
Discover a wide range of admin templates and themes on our website. Choose from our selection to optimize the appearance and operation of your website.
BUY NOW